Assuming we have installed the nagios monitoring server to a linux machine as described here.
In order to monitor a windows server we need to install an agent which we call NSClient. The following steps should be followed:
1. Download the installer from HERE
2. Extract and install
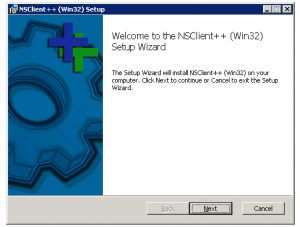
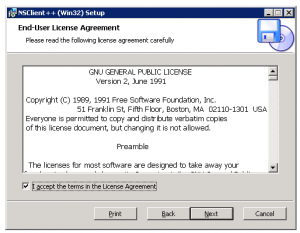
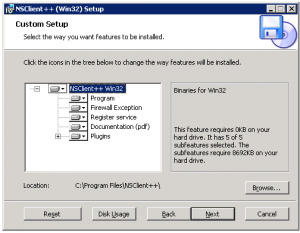
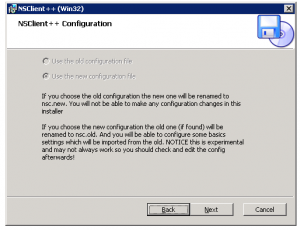
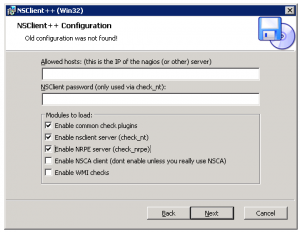
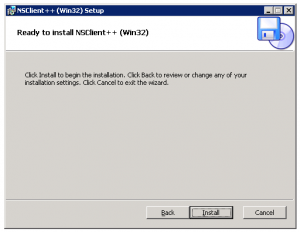
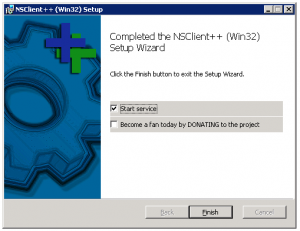
3. After the installation we need to configure the service to restart after 5 minutes upon failure to make sure the service wont goes down
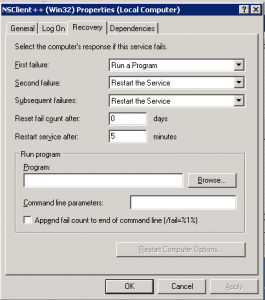
3. Set the PORT on the configuration file C:\Program Files\NSClient++\NSC.ini as follows:
...
[NSClient]
...
...
;# NSCLIENT PORT NUMBER
;  This is the port the NSClientListener.dll will listen to.
port=1248
...
...
4. Start the NSClient++ Service
Start the NSClient++ service either from the Control Panel -> Administrative tools -> Services -> Select “NSClientpp (Nagios)* and click on start (or) Click on “Start -> All Programs -> NSClient++ -> Start NSClient++ (Win32) . Please note that this will start the NSClient++ as a windows service.
Configuration Steps On Nagios Monitoring Server
From Nagios Monitoring Server
1. Verify check_nt command and windows-server template
Verify that the check_nt is enabled under /usr/local/nagios/etc/objects/commands.cfg
# 'check_nt' command definition
define command{
command_name    check_nt
command_line    $USER1$/check_nt -H $HOSTADDRESS$ -p 1248 -v $ARG1$ $ARG2$
}
2. Verify that the windows-server template is enabled under /usr/local/nagios/etc/objects/templates.cfg
# Windows host definition template - This is NOT a real host, just a template!
define host{
name                    windows-server  ; The name of this host template
use                     generic-host    ; Inherit default values from the generic-host template
check_period            24x7            ; By default, Windows servers are monitored round the clock
check_interval          5               ; Actively check the server every 5 minutes
retry_interval          1               ; Schedule host check retries at 1 minute intervals
max_check_attempts      10              ; Check each server 10 times (max)
check_command           check-host-alive        ; Default command to check if servers are "alive"
notification_period     24x7            ; Send notification out at any time - day or night
notification_interval   30              ; Resend notifications every 30 minutes
notification_options    d,r             ; Only send notifications for specific host states
contact_groups          admins          ; Notifications get sent to the admins by default
hostgroups              windows-servers ; Host groups that Windows servers should be a member of
register                0               ; DONT REGISTER THIS - ITS JUST A TEMPLATE
}
3. Uncomment windows.cfg in /usr/local/nagios/etc/nagios.cfg
# Definitions for monitoring a Windows machine
cfg_file=/usr/local/nagios/etc/objects/windows.cfg
4. Modify /usr/local/nagios/etc/objects/windows.cfg
By default a sample host definition for a windows server is given under windows.cfg, modify this to reflect the appropriate windows server that needs to be monitored through nagios.
# Define a host for the Windows machine we'll be monitoring
# Change the host_name, alias, and address to fit your situation

define host{
use             windows-server              ; Inherit default values from a template
host_name   remote-windows-host      ; The name we're giving to this host
alias            Remote Windows Host     ; A longer name associated with the host
address       172.20.10.219                   ; IP address of the remote windows host
}
5. Define windows services that should be monitored.
Following are the default windows services that are already enabled in the sample windows.cfg. Make sure to update the host_name on these services to reflect the host_name defined in the above step.
define service{
use                     generic-service
host_name               remote-windows-host
service_description     NSClient++ Version
check_command           check_nt!CLIENTVERSION
}
define service{
use                     generic-service
host_name               remote-windows-host
service_description     Uptime
check_command           check_nt!UPTIME
}
define service{
use                     generic-service
host_name               remote-windows-host
service_description     CPU Load
check_command           check_nt!CPULOAD!-l 5,80,90
}
define service{
use                     generic-service
host_name               remote-windows-host
service_description     Memory Usage
check_command           check_nt!MEMUSE!-w 80 -c 90
}
define service{
use                     generic-service
host_name               remote-windows-host
service_description     C:\ Drive Space
check_command           check_nt!USEDDISKSPACE!-l c -w 80 -c 90
}
define service{
use                     generic-service
host_name               remote-windows-host
service_description     W3SVC
check_command           check_nt!SERVICESTATE!-d SHOWALL -l W3SVC
}
define service{
use                     generic-service
host_name               remote-windows-host
service_description     Explorer
check_command           check_nt!PROCSTATE!-d SHOWALL -l Explorer.exe
}
6. Enable Password Protection
If you specified a password in the NSC.ini file of the NSClient++ configuration file on the Windows machine, you’ll need to modify the check_nt command definition to include the password. Modify the /usr/local/nagios/etc/commands.cfg file and add password as shown below.
define command{
command_name	check_nt
command_line	$USER1$/check_nt -H $HOSTADDRESS$ -p 1248 -s My2Secure$Password -v $ARG1$ $ARG2$
}
7. Verify Configuration and Restart Nagios.
Verify the nagios configuration files as shown below.
[monitor]# /usr/local/nagios/bin/nagios -v /usr/local/nagios/etc/nagios.cfg

Total Warnings: 0
Total Errors:   0

Things look okay - No serious problems were detected during the pre-flight check
Restart nagios as shown below.
[monitor]# /etc/init.d/nagios3 stop
Stopping nagios: .done.

[monitor]# /etc/init.d/nagios start
Starting nagios: done.
8. You should be able to verify the status of the various services running on the remote windows host from the Nagios web UI (http://172.20.10.217/nagios3).
